To study the effect of synchronization in the currently deployed 5G networks, we conducted a number of experiments with a R&S TSMA6 scanner42, which is capable of simultaneously measuring signals between 350 MHz and 6 GHz. The TSMA6 scanner makes use of an internal pulse per second (PPS) signal generator to determine the time of arrival of a 5G signal. The scanner requires a configuration procedure to select the frequency bands, load modules (e.g., 5G scanner and GNSS), and acquire GNSS signal. When it is fully configured, it is able to simultaneously measure multiple 5G signals (from different TRPs), outputting a measurement every 20 ms (the sampling frequency of the instrument is 30.72 MHz). Among them, the ones of interest for our study are the SSBs. Specifically, the scanner outputs the ToA of each detected SSB: this information is available under the technical name of “ToA PPS”42 since it uses the GNSS PPS for time reference. The “ToA PPS” refers to the time of arrival of the PSS within the SSB. We shall notice that a post-processing is performed by the scanner in order to retrieve the final Time of Arrival (ToA) value. The scanner’s internal processing involves the computation of the cross-correlation of the received signals, which is used to determine the top-N multipath components (i.e., the N components with the highest cross-correlation value). The decision value for this ranking is set to the average Signal-to- Interference-plus-Noise Ratio (SINR), which provides a balance between signal strength and quality. Among these top-N multipath components, the one with the lowest “ToA PPS” is selected for ToA estimation. This approach ensures robustness in mitigating the ambiguities due to early arrivals. It is important to note that the R&S scanner does not permit full access to physical level parameters, as it automatically performs TOA estimation processing. Therefore, the analyses we carried out are based on the processed output provided by the scanner. The datasheet of the R&S scanner specifies a granularity of 5 ns with good GNSS visibility. This level of precision allows for accurate measurements of the ToA of 5G signals, which is crucial for our study.
For measurement uncertainties, the scanner reports the chosen average SINR, which can be used as quality metrics of the measurements, and also the Synchronization Signal (SS)-Received Signal Received Power (RSRP)7, which we referred to as received power.
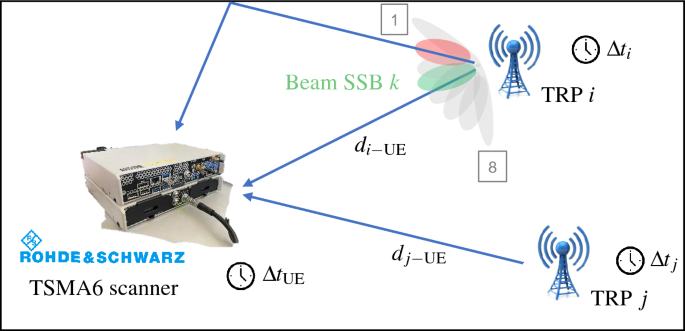
In Fig. 11, we show a concise representation of beams, i.e., SSBs, sent by the TRPs. Since the SSBs are transmitted over different spatial directions, the scanner acquires signals coming from both LOS and NLOS beams. Knowing the 5G frame structure, the employed numerology, and SSB transmission pattern and measuring the ToA of each SSB (if any), we estimate the distance between the transmitting TRP and receiving UE (i.e., the scanner). The measured delay of the received signal is composed of the Time of Flight (ToF) of the propagation, multipath effects, the additional contribution of desynchronization, and other sources of unknown errors inside the hardware.
We define with \(t_{\text {tx}}^{\text {(Start)}}\) the time of transmission of the beginning of the 5G frame at the TRP, with \(t_{\text {tx}, i}^{(k)}\) and \(t_{\text {rx}, i}^{(k)}\) the instants of transmission of the SSB k at TRP i and its reception at the scanner, respectively. The clock offsets of the receiver (i.e., the scanner) and of TRP i are indicated with \(\Delta t_{\text {UE}}\) and \(\Delta t_i\), respectively. Defining with \(\textbf{p}^{\text {TRP}}_i\) and \(\textbf{x}\) the position of the TRP i and of the scanner, respectively, our goal is to estimate the true ToF \(\tau _{i}^{(k)} = t_{\text {rx}, i}^{(k)} – t_{\text {tx}, i}^{(k)}\) from TRP i and SSB k to the scanner. The estimate is defined as:
$$\begin{aligned} \widehat{\tau }_{i}^{(k)} = t_{\text {rx}, i}^{(k)} + \Delta t_i – \left( t_{\text {tx}, i}^{(k)} + \Delta t_{\text {UE}}\right) + {\Delta t}_{\text {mp}} + {\Delta t}_{\text {n}} \approx \tau _{i}^{(k)} + \Delta t_i – \Delta t_{\text {UE}}, \end{aligned}$$
(1)
where \({\Delta t}_{\text {mp}}\) and \({\Delta t}_{\text {n}}\) are the range errors due to multipath and noise at the radio receiver, respectively. Given that our experiments were conducted in controlled (to the best of our possibilities) LOS conditions, where multipath effects are minimized and LOS is mainly guaranteed (at least for one beam), we assume the ToA measurements gathered by the R&S equipment refer to the direct path. As concerns the receiver noise, we observe that the standard deviation of the ranging error due to this source of error is nearly an order of magnitude smaller than the standard deviation of synchronization error. For this reason, we focus on the range biases due to synchronization error only, neglecting the characterization of error contributions \({\Delta t}_{\text {mp}}\) and \({\Delta t}_{\text {n}}\), leading to the approximation in (1).
The ToA measured by the receiving scanner for TRP i and SSB k is:
$$\begin{aligned} \widehat{\text {ToA}}_{i}^{(k)} &= t_{\text {rx}, i}^{(k)} – t_{\text {tx}}^{\text {(Start)}} + \Delta t_i – \Delta t_{\text {UE}} +{\Delta t}_{\text {mp}} + {\Delta t}_{\text {n}} \\ &\approx t_{\text {rx}, i}^{(k)} – t_{\text {tx}}^{\text {(Start)}} + \Delta t_i – \Delta t_{\text {UE}}, \end{aligned}$$
(2)
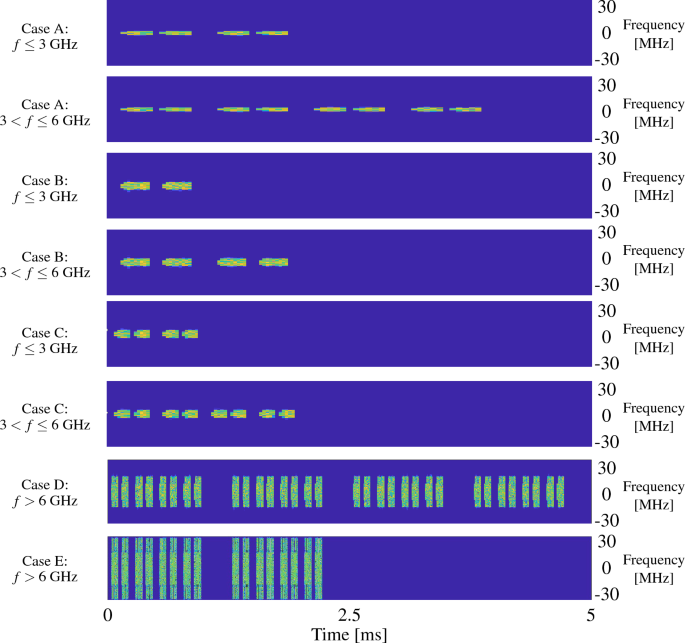
thus it is possible to compute the ToF by subtracting the time interval between the start of the 5G frame \(t_{\text {tx}}^{\text {(Start)}}\) and the expected transmission of the SSB \(t_{\text {tx}, i}^{(k)}\) to the measured arrival time \(\widehat{\text {ToA}}_{i}^{(k)}\). As an example, the interval \(t_{\text {tx}, i}^{(0)} – t_{\text {tx}}^{\text {(Start)}}\) for SSB 0 with numerology 1, \(f=3.68\) GHz and SSB Case C (see Fig. 1) is about 2 OFDM symbol intervals, i.e., 71.875 \(\mu\)s. We can then transform (1) into:
$$\begin{aligned} \widehat{\tau }_{i}^{(k)} &= \widehat{\text {ToA}}_{i}^{(k)} – \left( t_{\text {tx}, i}^{(k)} – t_{\text {tx}}^{\text {(Start)}} \right) \\ &\approx \left( t_{\text {rx}, i}^{(k)} – t_{\text {tx}}^{\text {(Start)}} + \Delta t_i – \Delta t_{\text {UE}}\right) – \left( t_{\text {tx}, i}^{(k)} – t_{\text {tx}}^{\text {(Start)}}\right) . \end{aligned}$$
(3)
This is possible if both the R&S and the TRPs have the common reference GNSS time and, therefore, they are able to nominally compute the same start of the frame \(t_{\text {tx}}^{\text {(Start)}}\) (except from the local clock errors).
After having measured the ToF with (3), by knowing the exact distance between the transmitting TRPs and the receiving UE it is possible to compute the synchronization error \(e^{(k)}_{synch,i}\) between TRP i and UE as:
$$\begin{aligned} e^{(k)}_{synch,i} &= \widehat{\tau }_{i}^{(k)} – \left( \frac{d_{i-\text {UE}}}{c}\right) \approx t_{\text {rx}, i}^{(k)} + \Delta t_i – t_{\text {tx}, i}^{(k)} – \Delta t_{\text {UE}} – \left( t_{\text {rx}, i}^{(k)} – t_{\text {tx}, i}^{(k)}\right) \\ &= \Delta t_i – \Delta t_{\text {UE}} , \end{aligned}$$
(4)
where \(d_{i-\text {UE}} = \Vert \textbf{p}^{\text {TRP}}_i- \textbf{x} \Vert _{2}\) is the distance between TRP i and the receiving scanner, while c is the propagation speed. The positions of the measurement points have been measured with Real-Time Kinematic (RTK) technology, and positioning services provided by SPIN3 GNSS43, by placing the RTK receiver right below the 5G antenna of the R&S scanner. Since RTK technology guarantees an accuracy of few centimeters44, considering the final error on 5G positioning in the order of several meters, we can safely use the RTK output as the exact UE coordinate. On the other hand, the coordinates of TRPs were measured by merging RTK surveys of the site boundaries (we remark that accessing the 5G sites and reaching the heights of the antennas is extremely challenging) with architectural drawings of the sites, resulting into highly-reliable information in the order of decimeters and still much lower than the 5G positioning error. We highlight that the clock difference \(\Delta t_i – \Delta t_{\text {UE}}\) cannot be separated into the two offset components as they are related to perfectly synchronized time-axes which cannot be measured. Therefore, we can just measure the difference in offset between two asynchronous clocks.

SSB beam sweeping along different directions. The receiver, i.e., R&S TSMA6 scanner, gathers both direct and reflected signals, experimenting a multipath delay. \(\Delta t_i\) and \(\Delta t_{\text {UE}}\) are the clock offset of the TRP i and UE, respectively. On the contrary, the distance between the TRP i and UE are indicated with \(d_{i-\text {UE}}\).
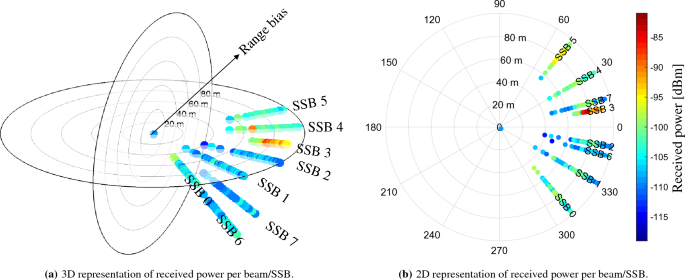
The ranging error will only consist of the offset between the clock of the scanner and the clock of the TRPs, under the assumption of LOS propagation. To guarantee such assumption, we need to understand which beam is in LOS, i.e., which beam is pointing towards the scanner. To this aim, knowing the azimuth and elevation of the panel array of the TRP, in Fig. 12 we report the associated power per SSB, i.e., per beam, together with the associated range bias values in the radial axes. By knowing the technical implementation features of the Vodafone 5G TRPs, we are able to state that the represented TRP in LOS (PCI 252) covers a spatial sector of 120 degrees in azimuth with 6 high-beams of roughly 20 deg beamwidth each and 2 low-beams of roughly 60 deg beamwidth each. The high-beams are referred to SSB numbers 0, 1, 2, 3, 4 and 5, while the low-beams with SSB numbers 6 and 7. For this specific TRP with PCI 252 in visibility condition, the beam with higher received power is the SSB number 3, with an average received power of about \(-90\) dBm. On the contrary, the received power for the other beams is as low as \(-120\) dBm. A peculiar fact is that, analyzing the spreads of the range bias samples, they appear to hold the same support, i.e., about 60 m as also shown in Fig. 4. This is due to the fact that the scanner is able to receive even very attenuated signals and that the low-power received signals are obtained from a direct path. Indeed, the radiation pattern of the antenna panel, even if highly directional, does not retain a null gain in the undesired directions of propagation. This aspect can be non-optimal for communication aspects (where high received power enables higher throughput), but it is still useful for positioning (where the key information is about the shortest path).
For the study in Section Clock offset coherence time, we computed the normalized autocorrelation function of the clock error time series \(y_t\) as37:
$$\begin{aligned} r_k = \frac{\sum _{t=1}^{T-k} (y_t – \bar{y})(y_{t+k} – \bar{y})}{\sum _{t=1}^T (y_t – \bar{y})^2} , \end{aligned}$$
(5)
where \(r_k\) is the autocorrelation at lag k, \(\bar{y}\) is the mean of the time series and T is the total number of observations. The coherence time is defined as the lag over which the autocorrelation drops below a given threshold. The threshold is obtained using two standard errors of the sample autocorrelation in the confidence bounds, where the formula for the standard error using Bartlett’s approximation is:
$$\begin{aligned} SE = \sqrt{\frac{1}{T}\left( 1 + 2\sum _{i=1}^{q} r_i^2\right) } \, , \end{aligned}$$
(6)
where q is the lag beyond which the autocorrelation function is 0.
Given the availability of a single 5G scanner, we carried out the range bias estimation and measurement collection for UE positioning on two separate datasets. In the urban scenario, we considered four reception points for range error computation at the beginning of the experiment and one reception point at the end for testing. On the contrary, in the rural area, we did the opposite procedure. Both the testing and measurements phases last about 250 s, while the intervals between each measurement point in both scenarios were approximately of 10 minutes. Given the unfeasibility of tracking in real-time the range biases, we used the median values of each range bias distribution as a-priori compensation, which were then averaged across the measurement points.
We should also note that, for real applications, the computed coherence time should serve as a reference time interval for estimating the clock offsets. In other words, range biases should be estimated and compensated at least once within the coherence time, or even more such as by continuously tracking.
UE positioning is performed every T seconds by gathering all ToF measurements from all the measured SSBs within the temporal window. Denoting with \(\varvec{\widehat{\tau }}_{i} = \{\widehat{\tau }_{i}(\ell )\}_{\ell =1}^{L_i}\) the set of ToF measurements from TRP measurements from TRP i at position \(\textbf{p}^{\text {TRP}}_i\) in the interval T, we compute the median value over the measured ToF for each TRP such that the aggregated vector \(\varvec{\rho }\) of all ToF measurements is created as:
$$\begin{aligned} \varvec{\rho } = \begin{bmatrix} \rho _{1} \\ \vdots \\ \rho _{N} \end{bmatrix} = \begin{bmatrix} \text {med}(\varvec{\widehat{\tau }}_{1}) \\ \vdots \\ \text {med}(\varvec{\widehat{\tau }}_{N}) \end{bmatrix}, \end{aligned}$$
(7)
where \(\text {med}(\cdot )\) is the median operator and N is the number of detected TRPs. Then, the UE bidimensional position estimate \(\widehat{\textbf{x}}\) , is computed according to the NLS algorithm with Jacobian matrix \([\textbf{H}]_{i-\text {th row}} = [\textbf{H}(\textbf{x})]_{i-\text {th row}} = \frac{\partial \text {h}_i(\textbf{x})}{\partial \textbf{x}}\), where \(\text {h}_i(\textbf{x}) =\Vert \textbf{p}^{\text {TRP}}_i- \textbf{x} \Vert _{2}\) is the ToF measurement model. The NLS algorithm is implemented with the iterative search of the estimate according to the Gauss-Newton methodology45 or EKF46 with random walk motion model47.

The radial axes represents the range bias in meters while the color indicates the received power for each measure. (a) and (b) show the beams in 3D and 2D, respectively.
The 95% confidence ellipse are obtained from the error covariance matrix \(\textbf{C}\) defined as:
$$\begin{aligned} \textbf{C} = \mathbb {E}[\Delta \widehat{\textbf{x}} \Delta \widehat{\textbf{x}}^{\text {T}}]\,, \end{aligned}$$
(8)
where \(\Delta \widehat{\textbf{x}} = \widehat{\textbf{x}} – \mathbb {E}[\widehat{\textbf{x}}]\). The 95% confidence level is computed considering an horizontal accuracy of \(2\sigma _H = 2\sqrt{{{\,\textrm{Tr}\,}}{(\textbf{C})}}\), where \({{\,\textrm{Tr}\,}}{(\cdot )}\) denotes the trace of the argument matrix. Finally, the MAE can be extracted as \(\text {MAE} = \mathbb {E}[\Vert \widehat{\textbf{x}}- \textbf{x} \Vert _{2}]\).
In order to have a lower bound on the positioning error, we computed the CRB by deriving the Fisher information matrix of the range-based localization problem48, which accounts for both the TOF measurement error and the geometrical condition of TRPs and UE. For CRB computation, we assumed the TOF measurements as Gaussian, unbiased and uncorrelated, and each link as single-path LOS. It follows that the standard deviation of the ranging measurement of TRP i is:
$$\begin{aligned} \sigma _{\tau , i} = \frac{c}{2\sqrt{2} \pi \sqrt{SNR_{i}} \,\beta }\,, \end{aligned}$$
(9)
where \(\beta\) is the effective bandwidth (here assumed to be equal to 7.2 MHz), and \(SNR_{i} \triangleq E_{s, i} /N_0\) is the signal-to-noise ratio which is directly computed by the R&S scanner. \(E_{s,i}\) is the average received energy from TRP i, while \(N_0/2\) represents the spectral density of the additive white Gaussian noise.
The final CRB covariance matrix \(\textbf{C}_{\text {CRB}}\) of the position estimate is obtained as:
$$\begin{aligned} \textbf{C}_{\text {CRB}} = \sigma _{\tau }^{2} \textbf{G}\,, \end{aligned}$$
(10)
where \(\textbf{G} = (\textbf{H}^{\text {T}}\textbf{H})^{-1}\) is the Geometric Dilution of Precision (GDoP)49 of the positioning problem and \(\sigma _{\tau } = \sqrt{{\mathbb {E}}_{{i}}\Big \{{\sigma _{\tau , i}^2}\Big \}}\).


