Sample collection and RNA extraction
Sample of E. rumphii was collected by trawling from the East China Sea, near Japan (30.9° N, 129.9° E), in compliance with the principles and requirements of the Nagoya Protocol. Various tissues, including gill, mantle, radula sac, digestive gland, white mucous gland, salivary gland, mouth, nerve, antenna, foot, and stomach, were dissected and immediately frozen in liquid nitrogen. The tissues of foot, mantle, and radula sac were respectively divided into four, three, and two parts, constituting biological repeats. While for other tissues, there were no repeats. Total RNA was extracted from each sample using TRIzol (Amibon, USA) following the manufacturer’s protocol. RNA integrity was assessed with the Agilent 2100 bioanalyzer (Agilent, USA).
SMRT bell library construction and sequencing
Equal amounts of RNA from each tissue were pooled to build the library. The construction of the full-length transcriptome library involved Oligo (dT) magnetic beads enrichment. This method allows for the enrichment of mRNA, as the majority of eukaryotic mRNA contains a polyA tail. The enriched mRNA was then reverse transcribed into cDNA using the Clontech SMARTer PCR cDNA Synthesis Kit. Subsequently, the Iso-Seq library was prepared following the Isoform Sequencing protocol (Iso-Seq), and the BluePippin Size Selection System protocol, as described by Pacific Biosciences (PN 100-092-800-03).
Once the library passed the quality control assessment, Iso-Seq was performed based on the PacBio Sequel II platform, considering the effective concentration of the library and the desired data output requirements.
Full-length transcript processing, error correction, and de-duplication
A total of 64.36 gigabytes of data and 964,550 Polymerase reads were generated. Subreads were then extracted by removing adapters and polymerase reads with a length less than 50 bp using the official PacBio software package, SMRTlink v8.0. Circular consensus sequences (CCS) were generated by correcting the subreads by comparing them with each other. These CCSs were then categorized into two groups: full-length sequences and non-full-length sequences, based on the presence of 5’ and 3’ adapters and polyA tails.
The full-length sequences were further processed by clustering them into cluster consensus sequences using a hierarchical n*log(n) algorithm. The cluster consensus sequences were corrected to obtain polished consensus sequences with Arrow software. To correct any additional nucleotide errors in the consensus reads, the Illumina RNA-seq data was utilized along with the LoRDEC223 software.
The corrected transcriptome sequences were then clustered and de-duplicated based on a 95% sequence similarity threshold using CD-HIT324. After this step, a total of 19,273 genes were generated, and these served as the reference sequences for subsequent analyses. The length distribution statistics after each step are presented in Table 1.
Illumina libraries constructions, quality inspection, and sequencing
The first strand of cDNA was synthesized using an M-MuLV reverse transcriptase system, with fragmented mRNA serving as the template and random oligonucleotide as the primer. The RNA strand was then degraded using RNaseH. Subsequently, in a DNA polymerase I system, the second strand of cDNA was synthesized from dNTPs. After purification of the double-stranded cDNA, it was repaired, and a tail was added, followed by a connection with the sequencing linker. The cDNA fragments of approximately 250–300 bp were selected with AMPure XP beads (Beckman Coulter, Beverly, USA). The PCR products were amplified and further purified using AMPure XP beads. A library was constructed for each sample, and the relationships between biological tissues and samples were documented in Table 2.
After libraries were constructed, initial quantification was performed using a Qubit2.0 Fluorometer. The libraries were then diluted to a concentration of 1.5 ng/ul and assessed for insert size using Agilent 2100 bioanalyzer. Once the insert size met the expected criteria, qRT-PCR was employed to quantify the effective concentration of the library, ensuring it exceeded 2 nM to ensure library quality. Finally, the libraries were sequenced on the Illumina NovaSeq6000 platform (illumine, USA) as 150 bp paired-end reads.
Quality control
Quality control was conducted using fastp v0.19.7125. Raw reads containing adapters, N (undetermined base), and low-quality reads were removed. The clean reads obtained after filtering were used for all subsequent analyses.
Sequencing error rate (Q20, Q30) and GC content of clean reads were calculated. For all samples, the Q20 and Q30 values exceeded 90, indicating high sequencing read quality. The GC contents ranged from 40% to 50%. Detailed results can be found in Table 2.
Functional annotation
Transcripts were annotated based on seven databases, including NCBInr (NCBI non-redundant protein sequences, http://www.ncbi.nlm.nih.gov), NCBInt (NCBI nucleotide sequences), Pfam (classification of protein families), KOG (eukaryotic ortholog groups), Swiss-Prot (a manually annotated and reviewed protein sequence database), KEGG (Kyoto Encyclopedia of Genes and Genomes), and GO (Gene Ontology). Most transcripts received annotations from the NCBInr database, with 15,733 transcripts (81.63%) being annotated. This was followed by the KEGG database, which annotated 15,122 transcripts (78.46%). The Swiss-Prot database annotated 13,168 transcripts (68.32%), and the GO database annotated 11,719 transcripts (61.81%). Among all transcripts, a total of 16,282 transcripts were annotated in at least one database while 3,270 transcripts were annotated in all seven databases. The specific software used for each database and the detailed annotation results can be found in Table 3.
In the NCBInr annotation, the results showed that 29.62% of the genes were aligned to Lottia gigantea, 18.58% were aligned to Crassostrea gigas, 17.07% were aligned to Aplysia californica, 6.90% were aligned to Biomphalaria glabrata, and 5.86% were aligned to Octopus bimaculoides.
In the KOG annotation, genes were grouped into 26 categories as shown in Fig. 3. The category with the highest number of genes was Signal transduction mechanisms with 2,057 genes, followed by General function prediction only with 2,003 genes, Posttranslational modification, protein turnover, chaperones with 1,144 genes, Transcription with 771 genes, and Cytoskeleton with 731 genes.
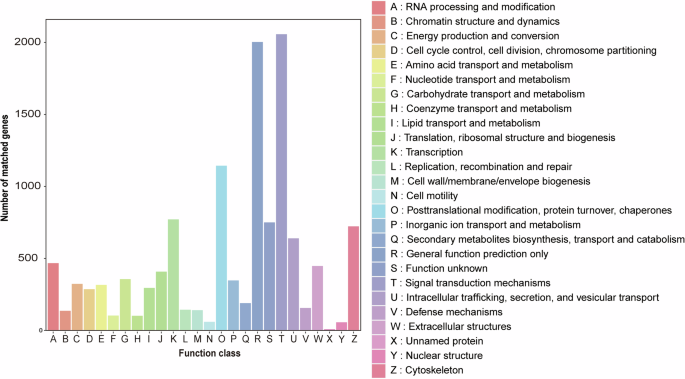
KOG annotation. Different KOG categories were shown on the x-axis, and the number of genes was presented on the y-axis.
For the KEGG annotation, genes were grouped into 358 pathways with six hierarchy 1 pathways and 45 hierarchy 2 pathways (Fig. 4). The category Signal transduction had the highest number of genes (1,544), followed by Cancers: overview (868), Transport and catabolism (778), Endocrine system (774), and Immune system (642).
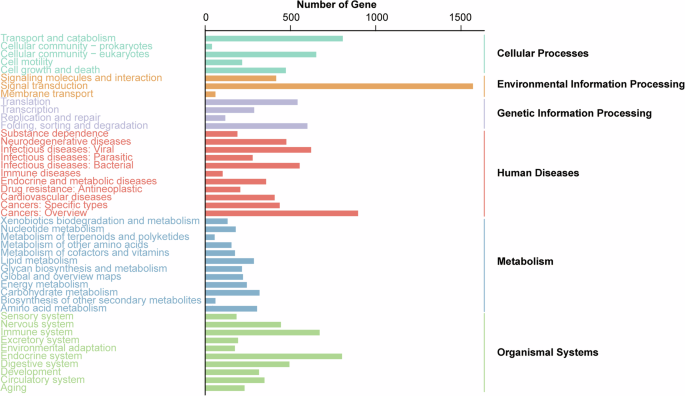
KEGG annotation. Different KEGG hierarchy 2 pathways were shown on the y-axis, and the number of genes was presented on the x-axis.
In the GO annotation, a total of 11,719 transcripts were assigned to 54 GO terms (Fig. 5). The GO term Binding had the highest number of genes (7,409), followed by Cellular process (5,250), Metabolic process (4,636), Catalytic activity (4,185) and Single-organism process (3,769).
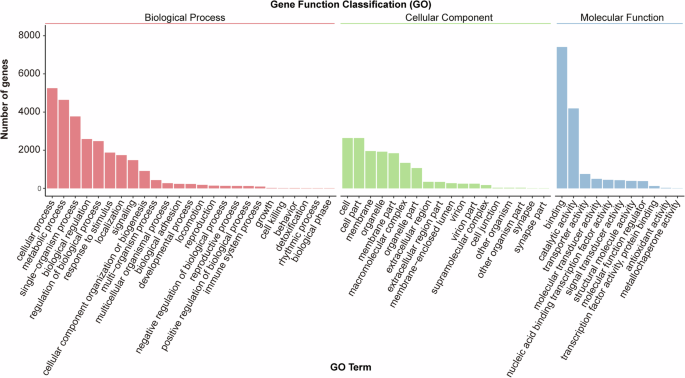
GO annotation. GO classifications were shown on the x-axis and the number of unigenes was presented on the y-axis.
CDS prediction
CDS (Coding sequences) prediction was performed using ANGEL v526 in error-tolerant mode. This prediction method primarily relied on machine learning algorithms, incorporating both codon usage frequency and protein structure information, which is challenging to apply to random model algorithms. A total of 19,031 CDS were predicted. The majority of the predicted CDS had lengths ranging from 0 to 2,500 bp (Fig. 6).
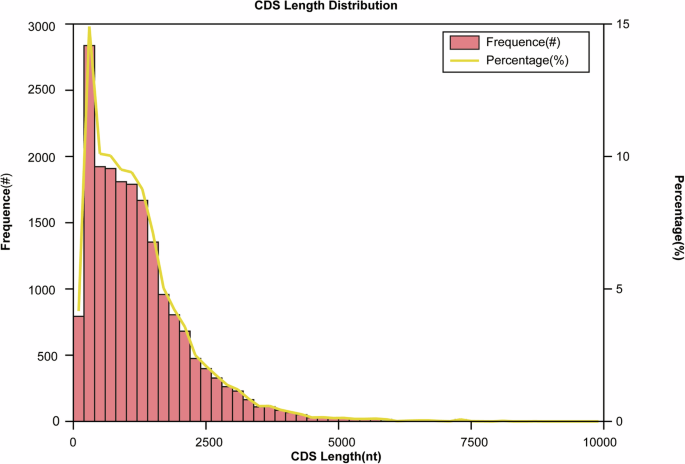
CDS length distribution. The length of the predicted CDS was shown on the x-axis, the number of CDS was shown on the left y-axis, and the proportion was shown on the right y-axis.
Gene transcription factor analysis
Transcription factors (TF) were identified by conducting HMMER searched against the animalTFDB 2.0 database based on Pfam files of transcription factor families.
A total of 737 genes were successfully grouped into 29 TF families. Among these families, The zf-C2H2 TF family had the highest number of genes (176), followed by the TF_bZIP family (77), the Homeobox family (62), the ETS family (55), the THR-like family (55), and the ZBTB family (55).
SSR analysis
Simple sequence repeats (SSRs) were detected by using MISA v1.0 (http://pgrc.ipk-gatersleben.de/misa/misa.html). The minimum repetition time was fixed as 10 for mononucleotides, six for di-nucleotides, and five for tri-nucleotides, tetra-nucleotides, penta-nucleotides, and hexa-nucleotides.
SSRs were detected in 19,273 genes with a length of 53,979,932 bp. SSRs were found in 7,292 genes and 2,387 genes contained more than one SSR. Most of the SSRs were mononucleotide repeats (8,002), followed by dinucleotide repeats (2,342), trinucleotide repeats (851), tetranucleotide repeats (347), hexanucleotide repeats (33), and pentanucleotide repeats (31). The results are represented in Table 4.
LncRNA analysis
According to the sequence features of the transcripts, coding potential prediction was performed using PLEK27 and CNCI28. The transcripts were further analyzed using CPC229 to evaluate the coding potential based on the biological sequence features of each coding frame. Finally, these transcripts were searched against Pfma-A and Pfam-B30 databases using hmmscan in HMMER to identify lncRNA sequences.
2,744 lncRNAs were predicted by PLEK, 4,755 lncRNAs were predicted by CNCI, 4,097 lncRNAs were predicted by CPC2, and 6,519 lncRNAs were predicted by Pfam. 1,236 lncRNAs were predicted by all four software.
Isoforms analysis
As there is no reference genome, the transcripts were processed using Cogent v3.1, a coding genome reconstruction tool. Each transcript family was reconstructed into a set of transcript models named UniTransModels. The non-redundant transcripts were then mapped to UniTransModels using GMAP31 v2017-06-20. Splicing junctions of transcripts that were mapped to the same UniTransModels were examined. Transcripts sharing identical splicing junctions were collapsed, and these transcripts with distinct splicing junctions were identified as transcription isoforms. Alternative splicing (AS) events were detected with SUPPA.
A total of 566 AS events were detected. Retained introns (RI) were the most prevalent type of AS event, accounting for 69.61% of the total. This was followed by alternative 5’ splice site (A5), which accounted for 18.37%, and alternative 3’ splice site (A3) events, which accounted for 7.6%. Skipped exons (SE) and alternative last exons (AL) constituted 3.18% and 1.24% of the events respectively.
Gene expression analysis
The clean reads sequenced with Illumina of E. rumphii were aligned to the reference transcripts using bowtie2. Read counts were calculated using RSEM32 and these counts were then converted to FPKM (Fragments Per Kilobase of exon model per Million mapped fragments).
For all 17 samples, the mapping rates were all above 60%, except for pi (salivary gland) and xx (digestive gland). Both of them are glandular tissues closely associated with gene expression and their specific functions. It is possible that only highly expressed genes were captured during transcriptome sequencing, resulting in a lower mapping rate.
For genes with FPKM greater than 1, we consider it to be efficiently expressed. A total of 17,388 genes were found to be expressed in at least one of the samples, indicating their transcriptional activity. Additionally, 6065 genes were expressed in all samples.
Differential expression analysis
Differential expression analyses were performed on the foot, mantle, and radula sac tissues, as these tissues had biological duplications. DESeq233 was used to quantify the expression of two expression profiles. Genes with adjusted p-value (pdaj) less than 0.05 and an absolute log2 fold change (|log2(FoldChange)|) greater than 1 were considered as differential expression genes (DEGs).
When comparing to the foot, 221 DEGs were identified in the mantle, with 179 up-regulated and 42 down-regulated. In the radula sac compared to the foot, 877 DEGs were found, with 220 up-regulated and 657 down-regulated. When comparing the radula sac to the mantle, 640 DEGs were found in the radula sac, including 132 up-regulated and 508 down-regulated.
Enrichment analysis
GO enrichment analyses of the DEGs were performed with GOseq, which utilizes the Wallenius non-central hypergeometric distribution. The DEGs were classified according to their biological process, cellular component, and molecular function features. Similarly, KEGG enrichment analysis of the DEGs was performed using KOBAS v3.034 based on hyper-geometric distribution. The DEGs were significantly enriched in these two analyses while the p-value or FDR less than or equal to 0.05.
In the comparison between the foot and mantle, the DEGs were significantly enriched into 43 GO terms, including 22 MF terms, 8 CC terms, and 13 BP terms. Among these, the most significantly enriched terms were Chitin binding, Chitin metabolic process, Glucosamine-containing compound metabolic process, Amino sugar metabolic process, and Aminoglycan metabolic process, which were related to the secretion and formation of the shell. Furthermore, the DEGs were significantly enriched into 14 KEGG pathways. Amino sugar and nucleotide sugar metabolism was the most significantly enriched pathway. Additionally, the RIG-I-like receptor signaling pathway and the Toll-like receptor signaling pathway were also significantly enriched.
In the comparison between the foot and radula sac, the DEGs were significantly enriched into 40 GO terms, with 19 MF terms, 8 CC terms, and 13 BP terms. The most significantly enriched terms included Extracellular matrix structural constituent, Structural molecular activity, Extracellular matrix, Metallopeptidase activity, and Cell-cell junction. The DEGs were significantly enriched into 14 KEGG pathways. The most significantly enriched pathways were protein digestion and absorption, ECM-receptor interaction, and PI3K-Akt signaling pathway.
As for the comparison between mantle and radula sac, DEGs were significantly enriched into 77 GO terms, with 28 MF terms, 13 CC terms, and 36 BP terms. The most significantly enriched term was Extracellular matrix structural constituent, followed by Chitin binding, Chitin metabolic process, Glucosamine-containing compound metabolic process, and Amino sugar metabolic process. The DEGs were significantly enriched into 13 KEGG pathways. The most significantly enriched pathways were ECM-receptor interaction, Focal adhesion, and PI3K-Akt signaling pathway.
Phylogenetic analysis
Phylogenetic analyses among Gastropoda were conducted based on the transcriptome data (Fig. 7). A total of 38 species were selected, covering all six subclasses of Gastropoda, along with seven outgroups from Bivalvia, Gastropoda, Cephalopoda, and Polyplacophora (Table 5). Raw reads in SRA format were extracted from the National Center for Biotechnology Information Sequence Read Archive (NCBI-SRA). The reads were filtered for quality and adapters using Trimmomatic v0.3935. De novo transcriptome assemblies were performed using Trinity v2.1.136, with a minimum assembled length of 300. Candidate coding genes and peptides were predicted using TransDecoder v5.7.1 with default settings. Orthogroups among these seven species were identified with OrthoFinder v2.4.037. The sequences were aligned with MAFFT v7.50538 and trimmed with BMGE v1.1239. Approximately maximum likelihood (ML) trees were constructed for each alignment using FastTree 240, and 1-to-1 orthologous sequences were identified using PhyloPyPruner v0.9.541. Finally, orthologous sequences sampled from at least six species were retained and concatenated into a matrix. An ML tree was constructed with IQ-Tree 242 based on the matrix, using the best-fitting partition model.
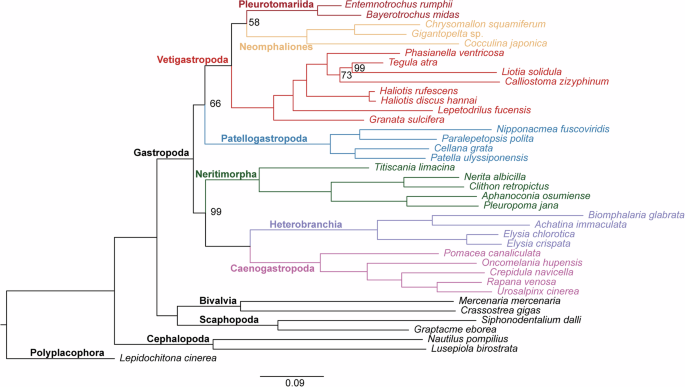
Phylogenetic tree of 31 species within Gastropoda, and seven outgroups based on transcriptome data. Unlabeled nodes represent a bootstrap (BS) value of 100.
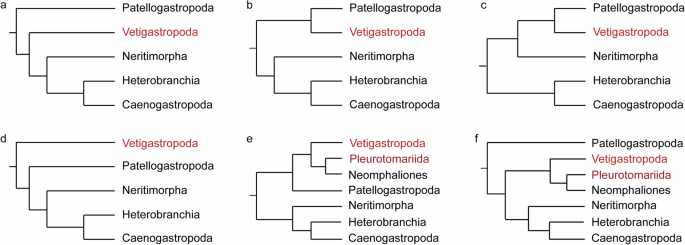
Gastropoda was recovered as a monophyletic group when rerooted with Polyplacophora species. The monophyly of all gastropod subclasses was supported, except for Vetigastropoda. Pleurotomarioidea was recovered as sister to Neomphaliones, and then grouped with other vetigastropods. This clade was then sister to Patellogastropoda. Another clade consisted of Neritimorpha, Caenogastropoda, and Heterobranchia, with Caenogastropoda being sister to Heterobranchia and grouped with Neritimorpha.
The phylogenetic position of Pleurotomarioidea was consistent with our previous study based on mitochondrial genomes43, suggesting that it may represent the most deeply diverging lineage within Vetigastropoda. The topology in which Pleurotomarioidea clustered with Neomphaliones was consistent with the most recent study of Gastropoda phylogeny22, indicating a close relationship between them. The definition of Vetigastropoda has been a subject of long-standing debate, with one of the main issues being whether Neomphaliones should be included16,44. In our study, Vetigastropoda was found to be paraphyly as Neomphaliones grouped with Pleurotomarioidea. This finding supported the perspective that Neomphaliones should be included in Vetigastropoda at the taxonomic level.


