Study area
The survey area is focused on Orkney, Scotland as a key area of maerl habitat5. Key sites were identified off the eastern coast of the mainland of Orkney near the isles of Wyre and Shapinsay. The survey area is defined in Fig. 6.
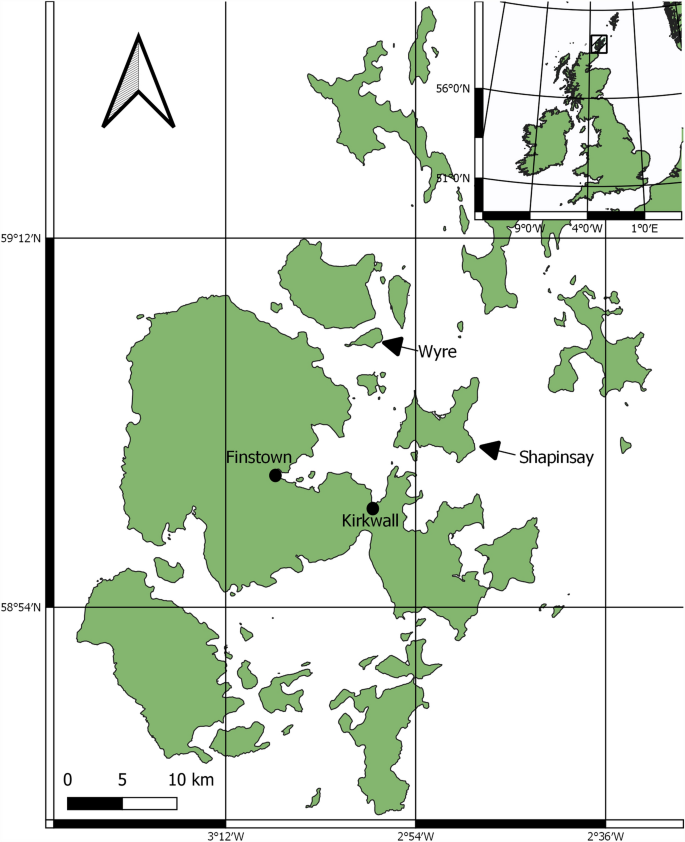
Suitable locations to survey maerl habitats were identified from Maximum Entropy (MAXENT) predicted models5, online records of maerl habitats65, and local expertise and knowledge; survey locations were also aligned with existing core data49. Key locations were identified south of Shapinsay (59° 01′ 22.1″ N 2° 51′ 06.1″ W), in Wyre Sound, just north of Wyre (59° 07′ 29.0″ N 2° 59′ 23.2″ W), and to the south of Wyre (59° 06′ 43.6″ N 2° 58′ 51.7″ W). The Shapinsay site features a mixed sediment substrate52 with only maerl presence and is hereafter referred to as the Shapinsay Maerl (SHM) site. The Wyre survey sites, however, feature maerl that exists alongside seagrass on a coarse substrate made up partially of dead maerl gravel; seagrass and maerl habitats overlap with seagrass interspersed in the maerl habitat, snapshots taken from DDV data to show this are available in the Supplementary material. There are three distinct areas to the Wyre survey sites. The first was a relatively evenly mixed seagrass and maerl (WSGM) site south of Wyre, the second was in Wyre Sound on a predominantly maerl habitat with patchy seagrass (WM), and the third site (WF) was at the east end of Wyre Sound which also featured a predominantly maerl habitat with limited seagrass presence. The third site (WF) was designated WF for Wyre flame shell, Limaria hians, as National Biodiversity Network (NBN) records66 indicated potential flame shell presence here; flame shell presence at the WF site, however, was unable to be ascertained from DDV data. All sites feature a mosaic of maerl abundance with associated fauna and flora.
Maerl beds around Shapinsay were in ~ 15 m of water, whilst maerl beds around Wyre were in much shallower depths of ~ 6–10 m in Wyre sound and ~ 4–6 m depths south of Wyre. The tidal range for Kirkwall, the nearest port, is 3.2 m; Kirkwall has a maximum tidal height of 3.4 m and minimum of − 0.2 m67.
Survey design and protocol
This study collated regional abiotic data61,62 and local core data49,51 to support the research aims. The survey collected SBP data with which to detail seabed depth (at fine scale) and sediment thickness, in addition to drop-down video (DDV) data to detail maerl and seagrass % cover. Survey data collection was conducted on MV Challenger with the help of a local marine operations consultancy team with previous experience in SBP operation and data collection68.
Maerl presence at each site was first confirmed with DDV footage. Once confirmed, transect survey lines were set as the vessel drifted with local water currents; this maintained vessel speeds of < 4 knts and avoided potential propellor induced disturbance on SBP data. Transect survey lines were set in conjunction with tide times to allow replication of survey lines and for tide adjustment of depth data in subsequent analysis. Maerl and seagrass % cover was recorded in real time from review of the DDV data at discrete points along the transect survey lines. Global Positioning Systems (GPS) data from the boat track plotter were used to align DDV footage with location. DDV data and maerl and seagrass % cover values were additionally checked in desktop data review.
Three suitable survey transect lines were determined for the Shapinsay maerl (SHM) survey site; SHM1, SHM2, and SHM3. Suitable survey lines were also set for each of the Wyre survey sites; WSGM1, WM1, and WF1. Core data were aligned to all survey sites; cores WM 1A, 1B, and 1C49 were aligned with the WM site, and cores WF 2A, 2B, and 2C49 with the WF site.
SBP surveys were then conducted on the transect lines using the same method of current drift with the DDV. GPS positioning data were recorded directly from the SBP. Data were recorded with an Innomar Compact SES 200069, fixed to the side of the boat using a bespoke attachment pole for SBP surveys. Due to the novel nature of this approach for blue carbon sediment thickness estimation, multiple operating frequencies were used. Transect lines were surveyed twice, simultaneously at Low Frequency (LF) at 8 kHz at − 6 dB and high frequency (HF) at 10 kHz and 7 dB, and then again using the multi-frequency (MF) setting which simultaneously recorded data LF data (at − 6 dB) and HF data (at 7 dB) at 5 kHz, 10 kHz, and 15 kHz. All data were recorded in RAW file format to capture all potential data from the survey. All SBP data channels and settings are detailed in the Supplementary material.
Survey data were named per transect line, i.e., SHM11 and SHM12 for the two SBP transects, one with LF and HF, and one using MF, conducted on SHM1. All SBP transects are listed as SHM11, SHM12, SHM21, SHM22, SHM31, SHM32, WM11, WM12, WF11, WF12, WSGM11, and WSGM12. Survey transects and survey areas are detailed in Figs. 7 and 8
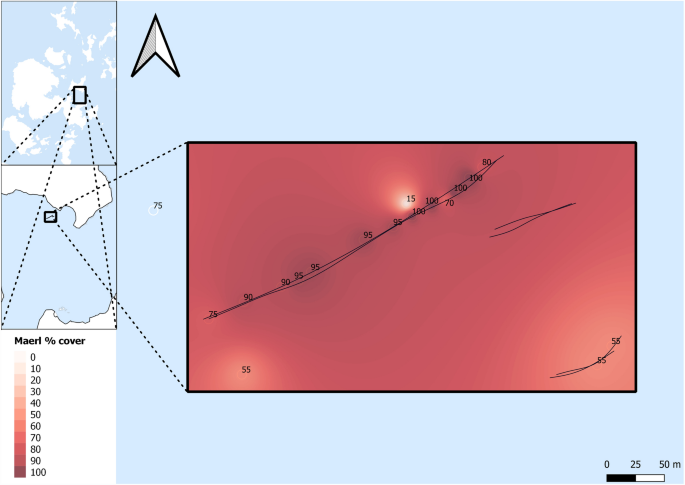
Shapinsay survey transects. SHM11 and SHM12 (top), SHM21 and SHM22 (middle), and SHM31 and SHM32 (bottom). Waypoint maerl % cover is noted in black text along the transects.
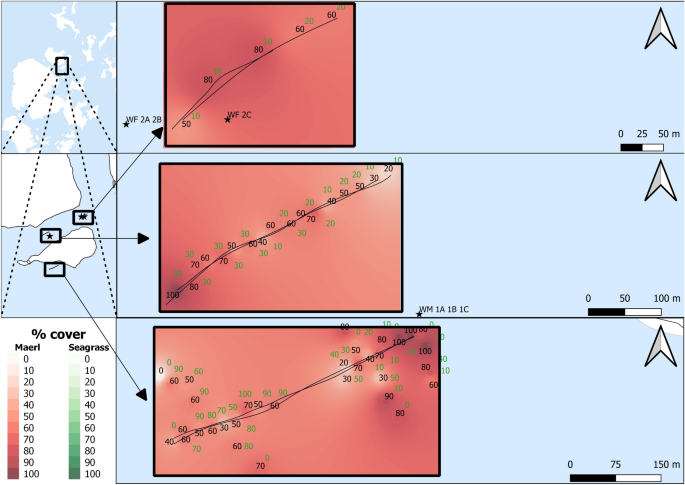
Wyre survey transects. WF11 and WF12 top, WM11 and WM12 (middle), and WSGM11 and WSGM12 (bottom). Survey core data for WF 2A, 2B, and 2C (top) and WM 1A, 1B, and 1C (middle). Waypoint maerl % cover is noted in black text, with seagrass % cover noted in green text, along the transects.
Data alignment with % cover
Maerl and seagrass % cover, estimated visually from DDV data, were imported with GPS positions into QGIS70. DDV data were collected across the whole transect, with observable changes in % cover recorded with the location marked as a waypoint; waypoint % cover data are detailed in Figs. 7 and 8. Maerl and seagrass % cover values were interpolated using the inverse distance weighted (IDW) method to convert point data to contiguous map data. Data points with no maerl cover were removed in the SEM analysis to avoid potential bias of data due to inaccurate identification of maerl habitats. At ranges of low maerl % cover, identification of maerl % cover was particularly difficult, with additional complications from trying to assess live and dead maerl on a dead maerl substrate from DDV data. Whilst a comparative identification of no maerl cover sediment against maerl habitat sediment thickness would have been interesting, the difficulty of accurately identifying no maerl and low maerl % cover suggested a more robust approach was to remove these data from subsequent analysis. SBP data were converted to SEGY file format using Innomar SES Convert software71. SEGY data .txt files, with GPS ping data, were also imported into QGIS then aligned to interpolated maerl and seagrass % cover values. Data were exported from QGIS as .txt files to allow import into SeiSee software72. This allowed for % cover values to be added to SEGY data and analysed with SBP data in Sonarwiz seafloor mapping and analysis software73.
Alignment with core data
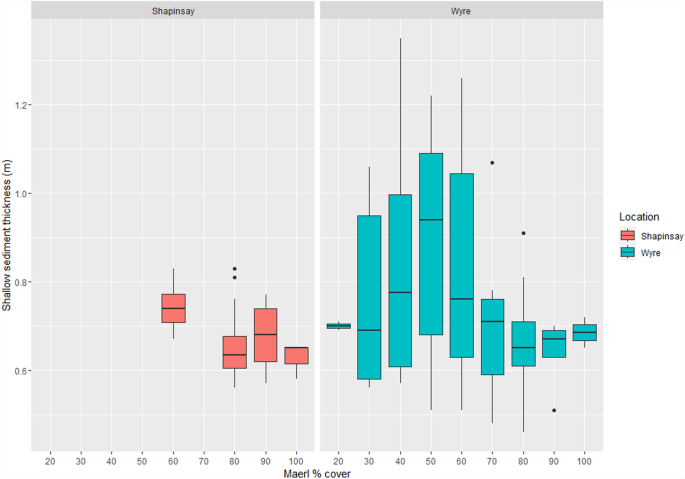
Core data, from maerl habitats in Wyre Sound, were reviewed from analogous research49 alongside other regional core data51,57,58, and wider research on acoustic data for blue carbon sediment quantification38,39,40. Patterns of sediment stratification from Wyre Sound core data49 were identified from Loss on Ignition (LOI) data, particle size analysis, and visual inspection. Cores contained live maerl from the sediment surface to 0.35 m depth; WM cores 1A, 1B, and 1C exhibited live maerl up to a sediment depth of 0.2 m, whilst WF cores 2A, 2B, and 2C contained live maerl up to a sediment depth of 0.35 m. All cores had a layer of shell fragments at sediment depths of 0.7–0.8 m. Both Organic Matter (OM) and Inorganic Carbon (IC) were correlated with depth, OM was generally negatively correlated with depth whilst IC had an inverse positive correlation with depth, with an additional distinct composition of OM and IC separated around the shell fragment layer at 0.7–0.8 m sediment depth; core data had a maximum thickness of 1.3 m at the WM site49. Similar layers in blue carbon sediments are reported in wider research13,45,63.
SBP data and aligned core data were reviewed in Sonarwiz with exposure, gain, and colour settings set to highlight sediment layers identified in the core data. Bottom tracking, using the ‘threshold detection’ algorithm, was used to detail the seabed in SBP files; blanking, duration, and threshold settings were adjusted per file for best fit. In addition to this seabed reflector, first multiples and bedrock were also identified and highlighted where applicable to further help with sediment layer identification. First multiples are reflections of the SBP pings hitting the seafloor repeated at twice the travel time to reach the seafloor; these were identified by selecting m/s travel time annotation in the preferences of image analysis in Sonarwiz. Sediment layers, identified and matched to the core data, were added as acoustic layers within the maerl survey transect files. Layers were identified with varying resolution and definition dependent on the SBP setting, with different results observed due to differences in channel dB and kHz ranges. Layer sediment thickness with reference to the seabed was determined using the ‘calculate thickness’ feature in Sonarwiz. Data were then exported as a .csv file, with associated maerl % cover, seagrass % cover, and depth and imported back into QGIS. Best available Orkney specific current speed61, and wave exposure62 data were matched to SBP ping data by GPS position in QGIS then exported for subsequent analysis in R74.
The settings used on analysis of SBP data in Sonarwiz exhibited variable results for sediment layer identification. Two potential layers, up to shell fragment layer and after shell fragments to total sediment thickness49, were most evident on two specific SBP channels. The shallow layer, up to shell fragments around 0.7–0.8 m and hereafter referred to as the Shallow Sediment Thickness (SST), was most readily evident on transects using the HF1 channel (7 db at 5 kHz). The shallow live maerl layer from the sediment surface down to 0.2–0.35 m was also partially evident at the top of the sediment on this channel, however, given the fine scale nature of this layer, and SBP data noise, identification of this layer was not sufficiently robust for further analysis. The deeper layer beyond the shell fragments at 0.7–0.8 m depth in the sediment, aligned to total sediment thickness and hereafter referred to as the Total Sediment Thickness (TST), was best aligned to the LF3 channel (− 6 dB at 15 kHz). First multiplies were generally evident on all channels, whilst the LF channel (− 6 dB at 8 kHz) was found to be the most viable for identifying bedrock underlying sediment layers. An example of data alignment of % cover, depth, seabed, and bedrock identification, from an analogous study on horse mussels45, is shown in Fig. 9.
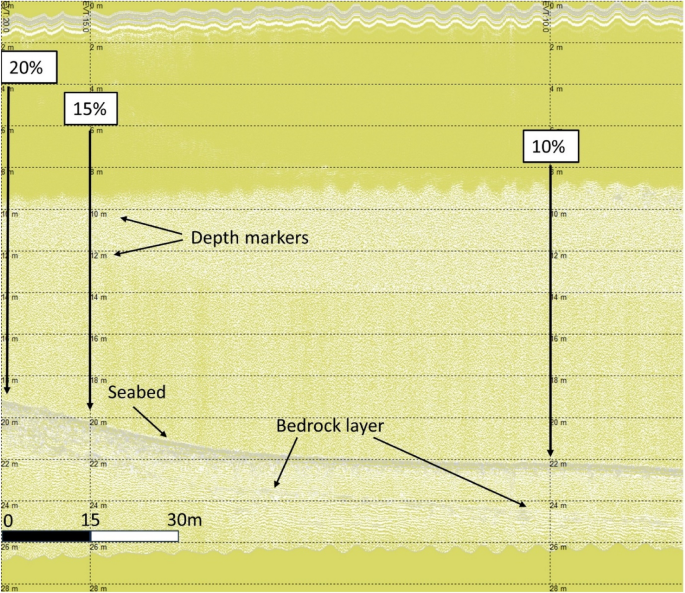
Shapinsay horse mussel LF data with clear identification of underlying bedrock.
Identification of varying sediment thickness on HF channels (7 dB at 10 kHz) further supported conclusions that layers identified were not erroneous interpretations of signal noise from the SBP pulse signature, but instead corroborated specific sediments. Examples of layer thickness variability, rather than monotone SBP noise, and linked to maerl % cover, can be seen in Fig. 10. From left to right in Fig. 10, maerl % cover changes from 100% down to 60%, briefly fluctuating back up to 70% from 60% before decreasing down to 60% again. On the left side of the image, in conjunction with greater % maerl cover, thicker sediment is evident in relation to that to the right side of the image, aligned with 60–70% maerl cover.
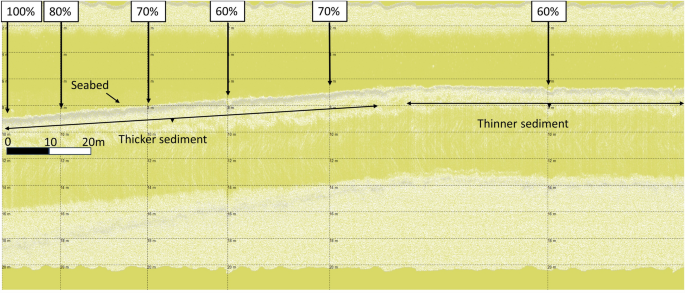
Wyre maerl (WM12) HF data with sediment thickness variability.
Maerl sediments are characterised by bands of light and dark grey on the SBP data. Particularly on the HF1 channel, a light grey band at the top of the sediment/seabed aligned to records of live maerl depths49 but could not be reliably identified. Identifying the dark grey band, however, was more feasible and definite. This dark grey band was most closely aligned to the SST at 0.7 m on the HF1 channel, and to the TST from 1.0 to 1.3 m, on the LF3 channel49. HF1 and LF3 channel data showing the live maerl, SST up to shell fragments at ~ 0.7 m sediment depth, and the TST at a sediment depth of ~ 1.3 m, can be seen in WM sites in Figs. 11 and 12 respectively.
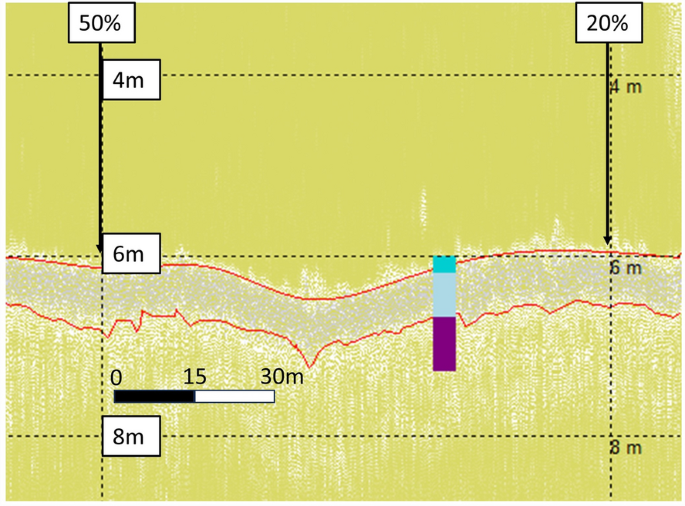
Wyre Maerl (WM11) HF1 data with aligned core data (cores WM 1A, 1B, and 1C) up to shell fragments, and termed the Shallow Sediment Thickness (SST), at 0.7 m49. Top 0.2 m layer of live maerl in dark turquoise, mixed maerl and gravel layer up to SST at 0.7 m in light blue, and anoxic fine mud and gravel layer down to Total Sediment Thickness (TST) of 1.3 m in purple. Top red line highlights the seabed, bottom red line highlights the SST identified in the core.
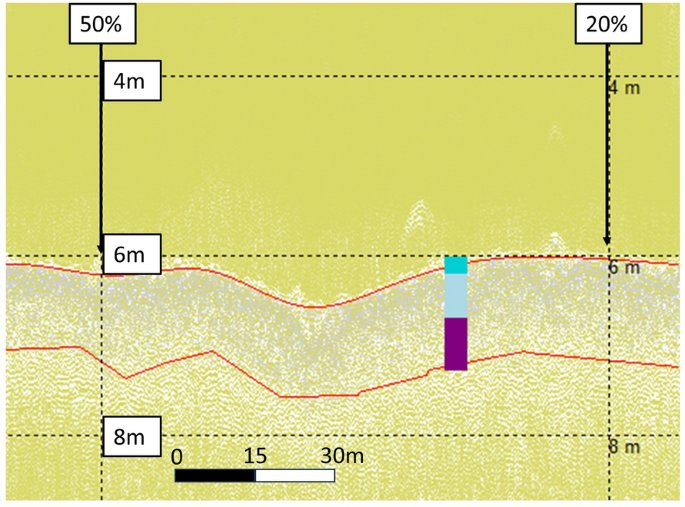
Wyre Maerl (WM11) LF3 data with aligned core data (cores WM 1A, 1B, and 1C) up to Total Sediment Thickness (TST) at 1.3 m49. Top 0.2 m layer of live maerl in dark turquoise, mixed maerl and gravel layer up to Shallow Sediment Thickness (SST) at 0.7 m in light blue, and anoxic fine mud and gravel layer down to TST of 1.3 m in purple. Top red line highlights the seabed, bottom red line highlights the TST identified from the core.
The alignment of the SST on the HF1 channel, up to shell fragments at 0.7 m sediment depth, and TST of 1.0 m on the LF3 channel can be seen in WF survey data in Fig. 13 and Fig. 14 respectively.
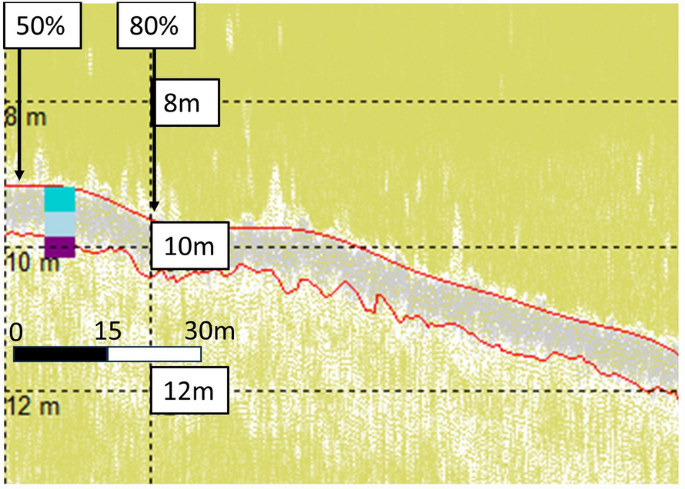
WF12 HF1 data with aligned core data (cores WF 2A, 2B, and 2C) up to shell fragments, and termed the Shallow Sediment Thickness (SST), at 0.7 m49. Top 0.35 m layer of live maerl in dark turquoise, mixed maerl and gravel layer up to SST at 0.7 m in light blue, and anoxic fine mud and gravel layer down to Total Sediment Thickness (TST) of 1.0 m in purple. Top red line highlights the seabed, bottom red line highlights the SST identified in the core.
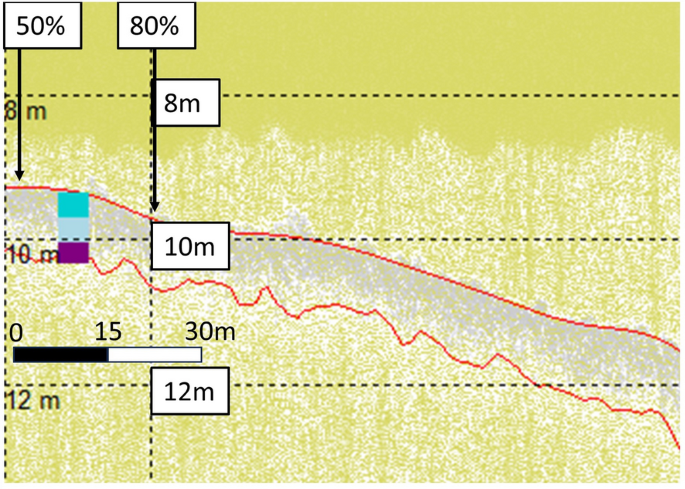
WF12 LF3 data with aligned core data (cores WF 2A, 2B, and 2C) up to Total Sediment Thickness (TST) at 1.0 m49. Top 0.35 m layer of live maerl in dark turquoise, mixed maerl and gravel layer up to SST at 0.7 m in light blue, and anoxic fine mud and gravel layer down to TST of 1.0 m in purple. Top red line highlights the seabed, bottom red line highlights the TST identified from the core.
Variables were tested for covariance and to determine best data; depth and current data were available from two different sources. Covariance and scaled covariance of principal components are provided in the Supplementary material. Principal Component Analysis (PCA) of the two subsets of data was also used to investigate differences between the two sites; Wyre and Shapinsay data. The PCA revealed site similarities and therefore subsequent suitability for extrapolation of data analysis between the sites. Given the key addition of seagrass exclusively to Wyre sites, however, subsets of data were analysed individually.
SBP data were assessed for spatial autocorrelation; average ping rate was 4 pings per second with each ping counting as a separate data point. Using the ‘points to path’ and ‘QChainage’ functions in QGIS, with data projected in EPSG:32630 to provide accurate distance, SBP transect data were subset at distance intervals of 1 m. Data at varying intervals were then assessed for spatial autocorrelation using a mix of Moran’s test and semi-variogram testing; this dual method can better pinpoint spatial autocorrelation coefficients than single method testing75,76. Data were generally found to exhibit non-significance in spatial autocorrelation tests at 5 m sample distance intervals in Moran tests. Two transects were better analysed in semi-variograms and sills were identified at 10 m sample distance intervals. A sampling distance interval of 10 m was set for all data for subsequent data analysis through Structural Equation Modelling (SEM). SEM was used to determine the relative influences and interactions of abiotic and biotic factors on maerl bed sediment thickness.
Final data were comprised of SBP data which contained latitude, longitude, a transect identifier, the SBP channel, sediment thickness, and depth (taken from the SBP data and adjusted for tide). DDV data comprised maerl % cover and seagrass % cover matched to each SBP data ping record. Finally, environmental data which were the most specific to Orkney were comprised of current speed61, wave exposure62, and substrate type52,77; substrate type was also corroborated for each transect from the DDV footage.
SEM pathway analysis was used to determine and highlight the distinct effects of abiotic and biotic variables on sediment thickness. For this purpose, SEM pathway analysis is better suited than generalised linear models (GLMs), Generalised Additive Models (GAMs), or other regression as the SEM pathway plots can clearly differentiate the coefficient loadings involved in the analysis and perform potentially independent multiple regressions simultaneously78. SEM pathway analysis undertaken for this study used a priori assumptions that environmental variables determine seagrass and maerl % cover, that both environmental variables and % cover determine sediment thickness, and that these are one-way relationships, for example, sediment thickness does not determine % cover. SEM pathway analysis was conducted using the R package ‘lavaan’ version 0.6–1579. Saturated models (df = 0) were used rather than over-identified models due to subset data limitations given the number of included parameters80. Maximum likelihood with robust standard errors (MLR) was used to deal with non-normality in the data subsets81.


